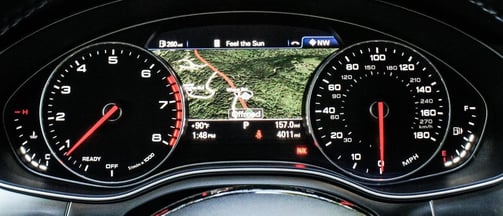
The definition for a traditional dashboard is fairly simple—“the panel facing the driver of a vehicle or the pilot of an aircraft, containing instruments and controls”—and well understood by anyone with much time behind the wheel.
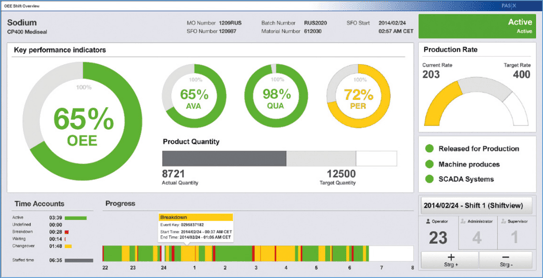
However, information technology dashboards in a business context take a few more words to describe. From Wikipedia, “dashboards often provide at-a-glance views of KPIs (key performance indicators) relevant to a particular objective or business process (e.g., sales, marketing, human resources, or production).” An example of such a dashboard for a single manufacturing process follows.
Although only recently popularized by commercial BI (business intelligence) software packages, dashboard-style display technology has been around a long time. Specifically, the PLC (programmable logic controller) industry saw early on that the PC (personal computer) was an ideal user interface platform for machine operators, providing what most would call today an interactive “dashboard” for a piece of equipment or portion of a manufacturing process. PLCs were originally designed as solid-state replacements for the relay panels used for sequence control for small- to medium-sized manufacturing equipment of limited complexity. Over time, they grew in sophistication to include PID (proportional, integral, differential) control capabilities for unit processes across a wide range of industries, and became a vital component of major manufacturing facilities worldwide.
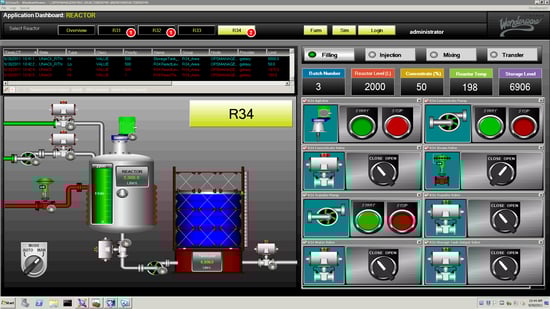
Despite the number of vendors that provided PLCs and the variety of applications they supported, all PLCs shared a common internal architectural feature called an “image register,” which is a section of memory that contains the process and state variables representing the complete status of the machine at any moment. Even though there were initially no industry standards that dictated the exact structure of an image register, they were similar enough that a basic PLC-specific driver was sufficient to map any PLC’s image register into the standard widgets of a dashboard-style operator interface, providing real-time display of process status and sometimes interactive control capabilities. One of the most successful such packages was the Wonderware InTouch software product, shown below in a batch process context.
Until recently, the lack of standardization in the embedded control system architectures for semiconductor manufacturing equipment made the implementation of equipment-oriented factory-level dashboards fairly challenging. However, with the advent of the SEMI EDA (Equipment Data Acquisition) standards and, in particular, the increasing fidelity of the equipment models required by these standards, all that has changed. Especially for equipment suppliers who follow the SEMI E164 (EDA Common Metadata) standard, the structure and content of the embedded equipment model are sufficient to provide direct access to most of the parameters and events you’d expect to find in a dashboard. Displaying some equipment KPI's, such as OEE, may require a little additional calculation and perhaps some minimal user input, but the most of information needed to compute these metrics is readily available.
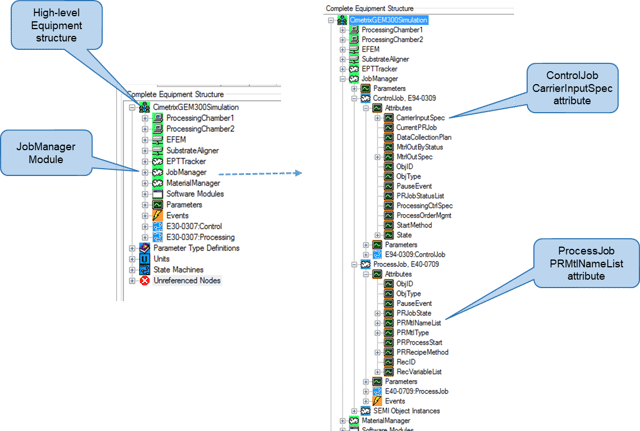
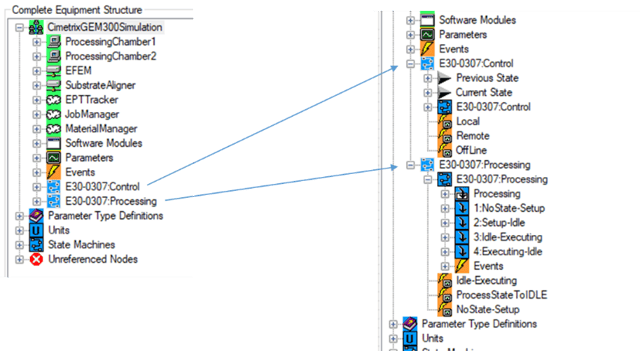
For example, if you want to see the list of jobs active on a piece of equipment, look no further than the JobManager logical element of the metadata model (see below*).
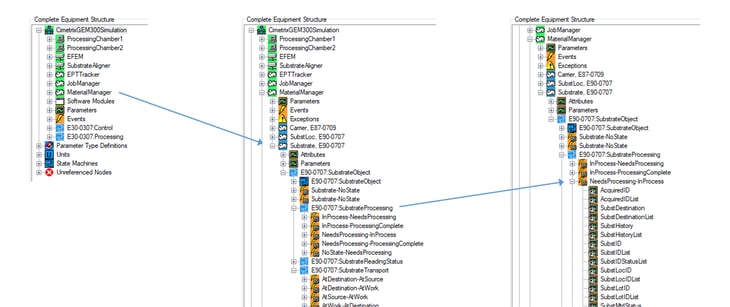
If you want to display the material status of a piece of equipment—for example the carriers, lots, and substrates that are present—the MaterialManager logical element contains all of this information.
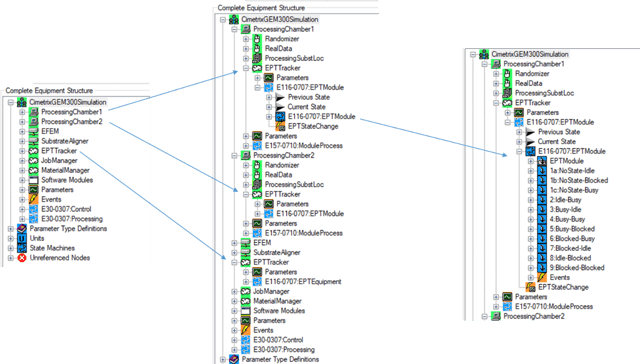
To display the current performance status and recent history of the major equipment modules, use the state information and reason codes in the SEMI E116 (Equipment Performance Tracking) EPTTracker logical elements to achieve this objective.
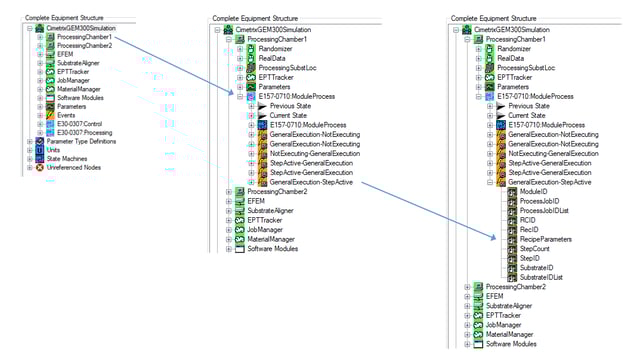
Recipe execution status information for each module capable of processing material is found in the ModuleProcess state machine within the relevant Process Chamber.
And finally, if you want to show the current operations status of the equipment as a whole, this information is found in the GEM variables present in the metadata model.
You can see from the above examples that despite the lack of standardization in the embedded equipment controller architectures across the semiconductor industry, the information needed in equipment level dashboards is directly provided by the industry standards that define the EDA interfaces. This provides yet another use case for factories to drive for the adoption of these standards.
In addition to the standardized data access, another feature of EDA that makes it ideal for dashboard implementation is its multi-client capability. The software implementing a factory-level dashboard can communicate with many pieces of equipment at once, since the data volume required from any single equipment is small. From the equipment point of view, the dashboard system would appear as a separate client from the other application client(s) with more intense data collection requirements. This separation of clients also means that the dashboard content can be changed easily, since this is accomplished by modifying the relevant DCPs (data collection plans) rather than changing the data collection application itself.
Last but not least, since SEMI E164 standardizes the actual event and parameter names in the metadata model, the DCPs that collect this information can be programmatically generated and activated for all the equipment that is E164-compliant. This represents a significant engineering cost reduction over the conventional methods used to identify, collect, and manage the information required to animate a real-time dashboard.
This article is the fifth in the series recently announced in the Models in Smart Manufacturing Series Introduction posting – be sure to watch for at least one more posting that wraps up this overall theme.
We look forward to your feedback and to sharing the Smart Manufacturing journey with you.
*The visualizations of equipment metadata model fragments are those produced by the Cimetrix ECCE Plus product (EDA Client Connection Emulator).