In this final article of the “EDA Application and Benefits” series we discuss an application that is one of the most basic and intuitive, but also provides the foundation for the many of the emerging capabilities in the machine learning and artificial intelligence (AI) domain—trace data analysis. Moreover, of all the applications we’ve introduced over the past 6 months, trace data analysis is the one that most directly leverages the capabilities of the SEMI Equipment Data Acquisition (EDA) standards.
Problem Statement
When we ask fab process engineers and their supporting automation teams why they are now requiring the latest SEMI EDA/Interface A standards on their new equipment, the answer we hear most often is “To better understand equipment and process behavior.” And when asked why this cannot be achieved using the SECS/GEM interfaces, the answers are equally consistent: “The detailed information we need is either unavailable or cannot be collected at the frequencies we need to accurately see and characterize the behaviors we are interested in. And even if this were possible, we don’t have the operational freedom to change our data collection systems as quickly as our needs change, so we must have a more flexible approach.”
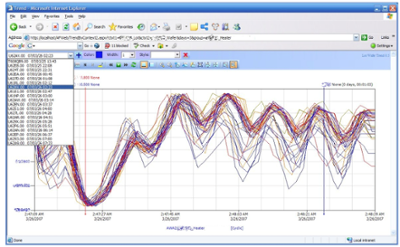
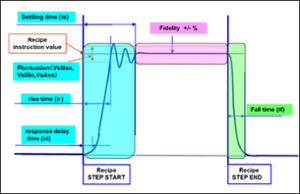
What these engineers are looking for as a starting point is a way to easily specify a list of potentially related equipment parameters and collect their values at a rate that is fast enough to see how they are changing in relationship to one another. Human beings are wonderful at pattern recognition, and simply being able to juxtapose a set of signals on a “strip chart” display (see first figure below) can yield important insights into the underlying process. Of course, this capability is most useful when the engineer can precisely specify the timeframe of interest for this visual analysis. This is sometimes called data “framing” and can be accomplished by using equipment events to bracket the period of interest (see second figure below).
While humans may be good at pattern recognition, they quickly get overwhelmed when the number of parameters to view grows and/or the timespan to consider expands… which is where trace data analysis software enters the picture.
Solution Components
In addition to very flexible time-series data visualization tools, trace data analysis software packages must be able to “slice and dice” subsets of large data sets to compare every imaginable combination of equipment instance, process chamber, product, layer, recipe, fixture, consumable batch, shift, operator, … (you get the picture) to look for correlations between important factory metrics and the behavior of the equipment involved. Moreover, they must be able to identify and flag “abnormal” (which must be flexibly defined) situations for further analysis, since these may hold clues about incipient failures that traditional multivariate FDC (fault detection and classification) applications may not catch.
In fact, there is an emerging school of thought for fault detection that states “most of the time, the equipment is making good wafers, so unless there’s something very different about the tool behavior between the most recent lots and the current lot (as determined through trace data analysis), it’s very likely that the current lot is good as well.” This simplified approach has also been called “model-less FDC” because it mostly compares trace data signals rather than passing tool parameters into highly context-specific multivariate statistics-based models.
Of course, any trace data analysis application is only as good as the data that feeds it… which is where the EDA standards and the related equipment purchase specifications come into the picture.
EDA (Equipment Data Acquisition) Standards Leverage
Previous postings such as Episode 4 on Fault Detection and Classification and Precision Data Framing during Process Execution – Tricks of the Trade have highlighted the capabilities of the Freeze II EDA standards related to Data Collection Plans (DCPs) and the Trace Requests, Event Requests, and Exception Requests that comprise them. We have also highlighted the need for broad stakeholder involvement when creating the EDA section of an equipment purchase specification and described the process we’ve crafted to accomplish this.
However, to fully support a world-class trace data analysis application, it’s important to understand what to ask of the equipment suppliers. To this end, we’ve excerpted some key sample requirements from a typical purchase specification below.
- Equipment Model Content (SEMI E120, E125, E164)
- The hierarchical depth of the metadata model should include at least the “field replaceable unit” (FRU) level, and one of two levels below this for complex sub-systems.
- The metadata model must contain command and status information for all equipment components that affect material movement. This includes not only material transfer elements such as robot arms, but also devices that may inhibit/enable material movement, such as gate valves, interlocks, etc.
- The metadata model must include control parameters for all significant operating mechanisms and subsystems in the equipment. The control parameters may include but are not limited to: process variable setpoints and status values; control variable status values; PID tuning parameters, control limits, and calibration constants.
- The metadata model must include whatever additional usage counters, timers, and other parameters that may be useful in time-based, usage-based, and condition-based maintenance scheduling algorithms.
- The metadata model must contain parameters the describe consumption rates and levels for key process resources such as electricity, process gases, and other consumables. These are used in some of the FDC models to detect potentially abnormal process conditions.
- Suppliers must provide a written description of the update rates, recommended sampling intervals, normal operating ranges and behaviors, and high/low/rate-of-change limits for all key process parameters.
- Etc.
- Data Collection Capability (SEMI E134)
- Equipment must include built-in DCPs to support common equipment performance monitoring, diagnostic, and maintenance processes that are well known to the supplier. Documentation for these DCPs must define their purpose, activation conditions, interface bandwidth consumed, and the types of analysis the collected data enables.
- Equipment parameters provided through the EDA interface must exhibit a number of data quality characteristics, including, but not limited to: an internal sampling/update rate sufficient to represent the underlying signal accurately; timing of trace reports that is consistent with the sampling interval within +/- 1.0%; values in adjacent trace reports must contain then-current values at the specified sampling interval; and rejection of obvious outliers.
- Performance Requirements
- Performance requirements will be expressed as combinations of sampling interval, # parameters per DCP, # of simultaneously active DCPs, group size, buffering interval, response time for ad hoc “one-shot” DCPs, maximum latency of event generation after the related equipment condition occurred, consistency of timestamps in trace reports with the specified sampling interval, and perhaps others.
- Example: The EDA interface must be capable of reporting at least 5000 parameters at a sampling interval of 0.1 seconds (10Hz) with a Group Size of 1, for a total data collection capacity (bandwidth) of 50,000 parameters per second. It must also support simultaneous data collection from at least 5 clients while still achieving a total bandwidth of 50,000 parameters per second; Group Sizes greater than 1 may be used to achieve this level of performance.
- Some equipment types may have more stringent performance requirements than others, depending on the criticality of timely and high-density data for the consuming applications.
 KPIs Affected
Trace data analysis will undoubtedly take its place among the other “mission-critical” applications in today’s fabs because of the increasing process complexity and the need to maintain the traditional “time to yield” production ramp. This is especially true for the industry pioneers now using the latest EUV scanners, as there will be much to learn about this new technology in the coming years.
Let Us Hear from You!

If you want to understand how the latest EDA standards and trace data analysis can support your future manufacturing objectives, or how to make this a reality in your Smart Manufacturing roadmap, please schedule a meeting!