
With semiconductor factories worldwide running a full capacity in most market segments, it is no wonder that productivity is now an important careabout across the industry. Factory managers carefully monitor their Key Performance Indices (KPIs) for any indications of lost productivity so they can react quickly to identify and address the root causes of these excursions. At the same time, they question whether their productivity metrics are presenting an accurate picture of factory performance, since these tracking systems may have been in place for many years and not updated to leverage the full suite of available productivity standards and the associated data collection infrastructure.
If you are one of the people harboring such questions, this blog posting and the information conveyed in the underlying presentation are for you. In them, we highlight the key principles of productivity management in a complex manufacturing environment, describe the spectrum of SEMI standards that have been defined and refined over many years to support this process, identify the various data sources, collection methods, and system components necessary to implement them, and provide several concrete examples of how these pieces fit together.
Productivity Principles
Manufacturing productivity management can be tricky because there are inherent tradeoffs in some of the metrics (see intuitive illustration). Consequently, they must be considered as a set rather than individually…
- Quality
- Capacity
- Throughput
- Cycle time
- WIP levels
- On-time delivery
- Equipment utilization
One of the most obvious examples is the conflict between equipment utilization and cycle time, especially in a wafer fab setting with reentrant, cyclical processes that use the same equipment multiple times. To minimize cycle time, you would want to ensure that product material never had to wait for equipment to become available. However, that will leave non-bottleneck equipment idle some of the time. On the other hand, if you maximize equipment utilization, WIP (Work in Process) levels will rise, degrading the cycle time for material queued for the next equipment type in its process flow. And so on.
SEMI Standards for Productivity Improvement
SEMI has a long history of defining standard metrics for the measurement and monitoring of equipment and factory productivity, but few, if any, companies take full advantage of these standards. Likely reasons for this include lack of awareness of what standards are available, limited understanding of what it takes to implement them, insufficient connectivity to the data sources required for a robust implementation, limited financial and personnel resources to build such a system, and no continuity of the subject matter expertise needed to oversee a comprehensive productivity management strategy. Daunting challenges, to be sure, but worthwhile to overcome in the current capacity-constrained environment.
This posting targets the first two of these challenges, and with the connectivity solutions in our product portfolio, we at the Cimetrix Connectivity Group of PDF Solutions can help address the third.
The SEMI standards that address Overall Equipment Effectiveness/Efficiency (OEE) include:
- E10, E58 – Equipment Reliability, Availability, Maintainability (RAM, ARAMS)
- E79, E116 – Measurement of Equipment Productivity, Equipment Performance Tracking
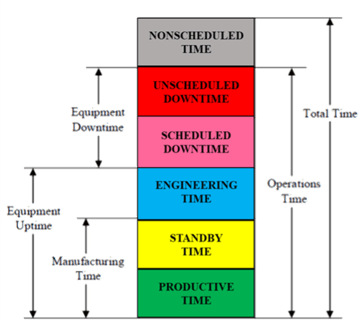
The principal objective of these standards is to account for every minute of an equipment’s life in the factory, dividing that time up into non-overlapping states to highlight and maximize the time spent in “productive” states while minimizing and identifying the root causes of the time spent in “non-productive” states. These standards have evolved over time from the initial definition of the six E10 equipment states (see figure below) to the definition of many useful sub-states, specification of formulas for calculating various measures of efficiency and “loss” categories based on these states, adaptation of these formulas to complex, multi-module equipment types, description of methods for automating the collection of event data that chronicle the transitions from state to state, and so on.
 It’s a lot of information to absorb, but each step along an implementation path can yield a return on that investment through the improvement of OEE-related KPIs.
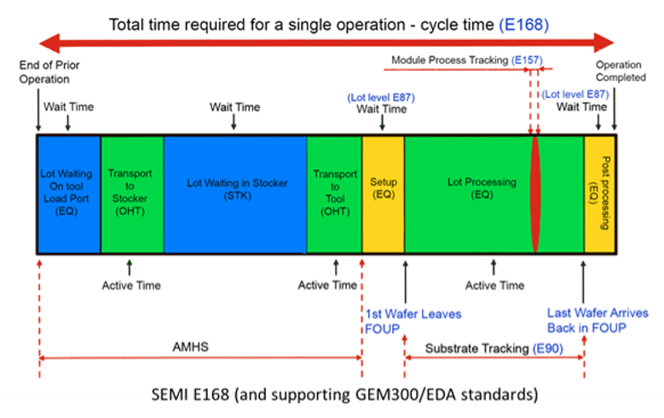
A more recent but less familiar SEMI productivity standard has the same “account for every minute” objective but looks at the life cycle of the product material (lots, substrates, devices) in the factory rather than the equipment. These standards emerged from the Sematech “Wait Time Waste” initiative—now called Product Time Measurement—and consist of the following:
- E168 – Specification of Product Time Measurement (terminology, concepts, time elements, etc.)
- E168.1, .2, .3 – PTM for 300mm production equipment, Material Control Systems (MCS), and transport equipment (AMHS)
These standards divide product material time into two major states—“active” and “wait”—and then define explicit “time elements” (and associated GEM/GEM 300 begin/end triggering events) within those categories that describe what was happening to the material (processing, movement, outgassing, etc.) during its “active” time, and what/who it was waiting for (FOUP unload, robot arm, gate valve opening, recipe start, etc.) during its “wait” time. The figure below shows a sequence of wait and active time elements for a lot between the completion events of two contiguous process steps.
 Conservative estimates from factory operations managers familiar with the behavior of complex multi-chamber equipment suggest that there is 5-7% of untapped capacity in this kind of equipment that a product material-focused standard like E168 could expose and capture.
Infrastructure Implementation Technologies
After determining which of these standards you want to implement and to what extent, the remaining tasks deal with identifying the specific data sources/elements in the factory that must be connected to your data collection infrastructure and creating the pathways for this data to flow. Fortunately, over 95% of the information needed is referenced in at least one of the following SEMI standards suites:
GEM/GEM300
- E30, E40, E94 – Machine States, Process Job Management, Control Job Management
- E87, E90 – Carrier Management, Substrate Tracking
- E157 – Module Process Tracking, Recipe Execution Tracking
Equipment Data Acquisition (EDA / Interface A)
- E120, E125, E164 – Equipment Metadata Model
- E132 – Authentication and Authorization
- E134 – Data Collection Management
Moreover, there is plenty of commercial software available that implements these standards, so there is absolutely no reason to tackle this in-house. Nevertheless, the remaining challenge in this process is validating that the suppliers have faithfully implemented the standards in their equipment and that the semantics of the events called for in the productivity standards are consistent across the factory. For example, 300mm process equipment that provide a SEMI E164-compliant (EDA Common Metadata) EDA implementation will include the complete set of GEM 300 events with identical sets of state/event/parameter names. Other equipment interface implementations may have slight variations that require a custom mapping layer in the event handling.
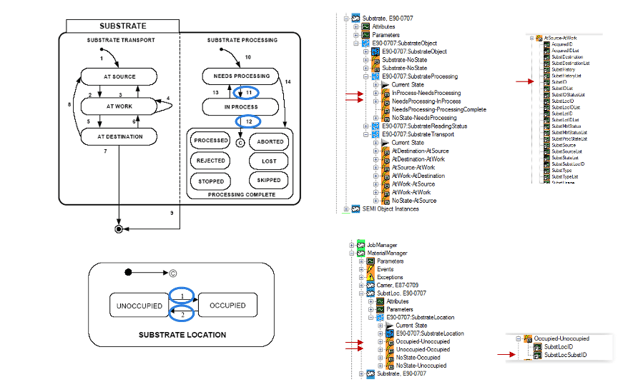
The figure below shows the E90 (Substrate Tracking) state machines used in some of the E168 time element definitions, and the corresponding E164-compliant metadata model content used to define the EDA Data Collection Plans (DCPs) that provide this information in real-time.
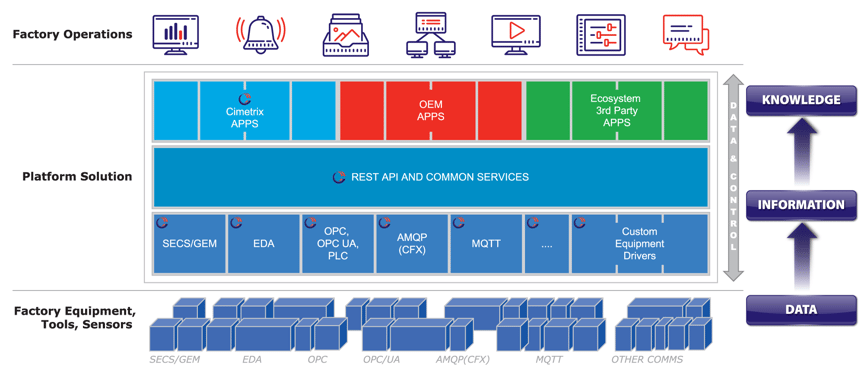
 On the “factory side of the wire,” it makes sense to incorporate modern commercial system technology as well, especially since a new productivity infrastructure could be implemented as a separate, complementary system rather than trying to squeeze it into an existing factory system architecture. A high-level diagram of a cloud-native instance of such a system is shown below. Note that it features a broad range of data source types (equipment, subsystems, sensors) using multiple connectivity standards (GEM, EDA, OPC UA, MQTT) at its lowest layer, all abstracted by a layer of RESTful APIs that in turn support a multi-supplier application ecosystem.
Want to know more?
This material has recently been accepted for presentation at the 20th European Advanced Process Control and Manufacturing Conference (apc|m) in Toulon, France (4-6 April 2022) – we hope to see (or hear) you there. Between now and then, you can access a preview copy here, and feel free to contact us with any questions.